
Understanding Houston’s Neighborhood Crime Patterns for Better Security Planning
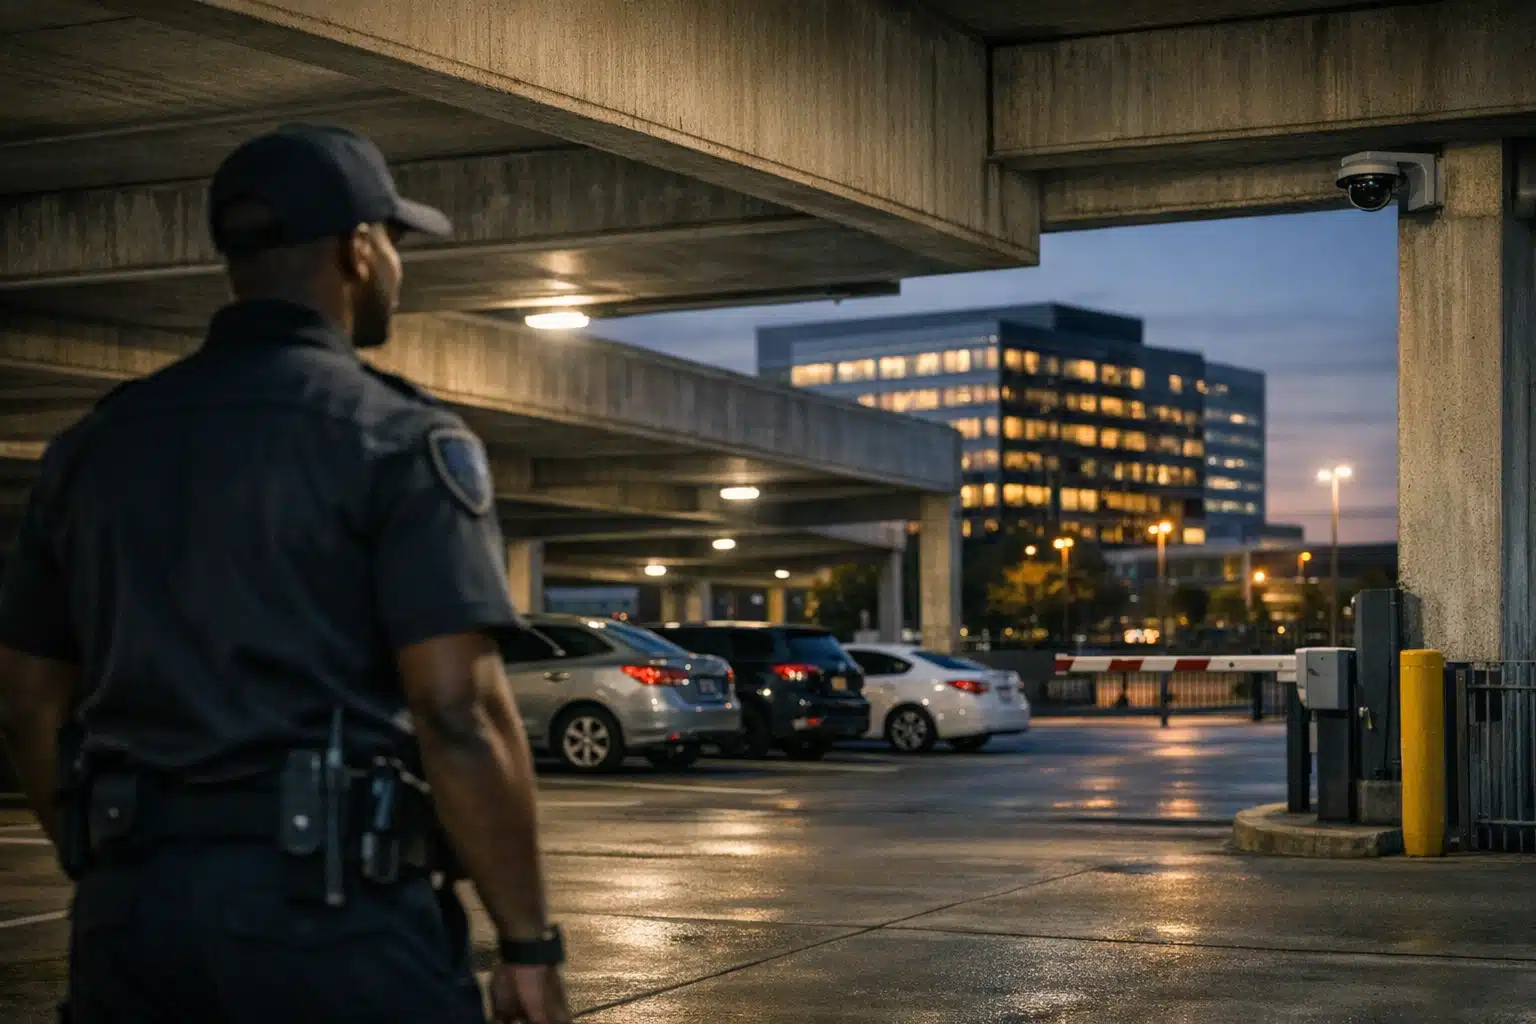
Why Houston Crime Patterns Shift Block by Block
Houston covers more than 600 square miles. Crime risk is not spread evenly across that area.
A warehouse near the Port of Houston faces different threats than a retail center in Katy. Houston crime patterns change by district, time of day, and even by season.
Reading those patterns matters for your security planning. This post breaks down how crime data differs across Houston areas and what each pattern means for your property.
We work these neighborhoods every day. The examples below come from real risk assessments across the Houston region.
How Houston Crime Patterns Differ by Area
Houston crime patterns fall into recognizable categories based on land use. Commercial, industrial, residential, and mixed-use zones each attract specific crime types.

Here is how the risk profile shifts across major Houston districts.
Energy Corridor: Office Burglary and Vehicle Crime
The Energy Corridor along I-10 West holds corporate campuses and parking structures. After-hours office burglary and vehicle break-ins drive most incident reports here.
Empty parking garages on weekends create soft targets. Thieves target catalytic converters and electronics left in cars.
- Peak risk times: Friday evening to Monday morning
- Common targets: Parking decks, ground-floor office suites
- Best countermeasure: Remote video monitoring with live voice-down capability
Port of Houston: Cargo Theft and Trespassing
The Port of Houston moves massive freight volume daily. Cargo theft, fuel theft, and perimeter trespassing define the risk here.
Organized crews study shipment schedules. They strike loading yards during shift changes when attention drops.
Texas cargo theft losses run into the hundreds of millions each year. Gulf Coast ports sit among the most targeted locations statewide.
Industrial East Houston: Metal Theft and Equipment Loss
East Houston and the Ship Channel hold refineries, chemical plants, and storage yards. Copper theft and heavy equipment theft dominate incident logs.
Scrap metal prices drive spikes in copper wire and pipe theft. Idle construction equipment disappears during turnaround periods.
Retail Centers in Katy and The Woodlands: Shoplifting and Parking Lot Crime
Suburban retail hubs face daytime shoplifting and evening parking lot incidents. Smash-and-grab vehicle theft rises during holiday shopping months.
Katy and The Woodlands report lower violent crime than central Houston. Property crime against shoppers and tenants stays the main concern.
Apartment Communities Across Southwest Houston: Mixed Threats
Multifamily properties in Southwest Houston see a wider mix. Package theft, vehicle burglary, and trespassing happen across daytime and overnight hours.
Open parking and multiple entry points make access control difficult. Resident turnover adds to the risk.
Reading Seasonal Houston Crime Patterns
Houston crime patterns shift with the calendar, not just by location. Weather and economic cycles push risk up and down.
Hurricane Season and Evacuation Windows
Gulf Coast storms create security gaps. Evacuated commercial sites and empty facilities draw looting and opportunistic theft.
Refinery shutdowns before a storm leave equipment exposed. Remote monitoring keeps eyes on a site when staff cannot stay on location.
Refinery Turnaround Periods
Turnarounds bring hundreds of temporary contractors on site. Tool theft and badge fraud rise during these windows.
More workers mean more vehicles, more access points, and more confusion. Clear credential checks cut down on loss.
Holiday Retail Surge
November and December push parking lot crime higher at retail centers. More shoppers mean more vehicle break-ins and cart thefts.
How to Match Security Planning to Local Crime Patterns
Good security planning starts with mapping your property’s specific risk. A port terminal and a Katy strip mall need different setups.
Follow these steps to align protection with real Houston crime patterns.
- Pull local crime data. Use Houston Police Department crime maps for your exact ZIP code and beat.
- Identify your peak risk windows. Match incident times to your staffing gaps.
- Map your weak points. Find unmonitored entrances, dark lots, and blind corners.
- Choose the right coverage type. Decide between on-site guards, remote video monitoring, or both.
- Set escalation rules. Define who gets called and when during an incident.
- Review quarterly. Crime patterns move. Your plan should move with them.
When On-Site Guards Make Sense
On-site guards fit sites with high foot traffic or active access control needs. Apartment gates, construction entrances, and retail floors benefit from a physical presence.
A visible officer deters trespassing and handles live confrontations. Guards also manage credential checks during refinery turnarounds.
When Remote Video Monitoring Fits Better
Remote video monitoring covers large perimeters at lower cost. Construction yards, storage lots, and vacant evacuated sites gain from it.
Trained operators watch live feeds and issue voice warnings. That stops trespassers before theft happens.
- Construction sites: Protect equipment during off-hours and turnarounds
- Energy facilities: Monitor fence lines and tank farms remotely
- Port yards: Watch cargo zones during shift changes

 Posted on Google
Texas Rules That Shape Your Security Plan
Texas regulates private security under the Department of Public Safety. Licensed guard companies must meet state training and registration standards.
Hiring a licensed provider protects you from liability. Verify that your company holds a current Texas DPS Private Security license before signing.
Energy and port facilities face added federal rules. Maritime sites fall under Coast Guard security requirements, and chemical plants answer to CFATS standards.
Turning Crime Data Into a Site-Specific Plan
Raw crime numbers mean little without local reading. A refinery manager and an apartment operator need different takeaways from the same data set.
Our team walks each Houston property before recommending coverage. We match guard placement and camera angles to the real patterns in your area.
That site-level analysis separates effective protection from wasted budget.
Conclusion
Houston crime patterns change by neighborhood, season, and property type. Smart security planning reads those patterns and matches coverage to real risk.
Twin City Security Houston builds site-specific plans using local crime data and on-the-ground assessments. Call 832‑301‑9478 or email Houston@Twincitysecurity.com for a Houston security assessment or monitoring quote.
Sources
Recent Posts